

Goals
- Help them understand how often customers call customer support after their first inquiry; this will help leaders understand how effectively the team can answer customer questions the first time.
- Provide insights into customer issues that generate more repeat calls.
- Explore repeat caller trends in the three different market cities.
- Design charts so stakeholders can view trends by week, month, quarter, and year.
Repeats by Month
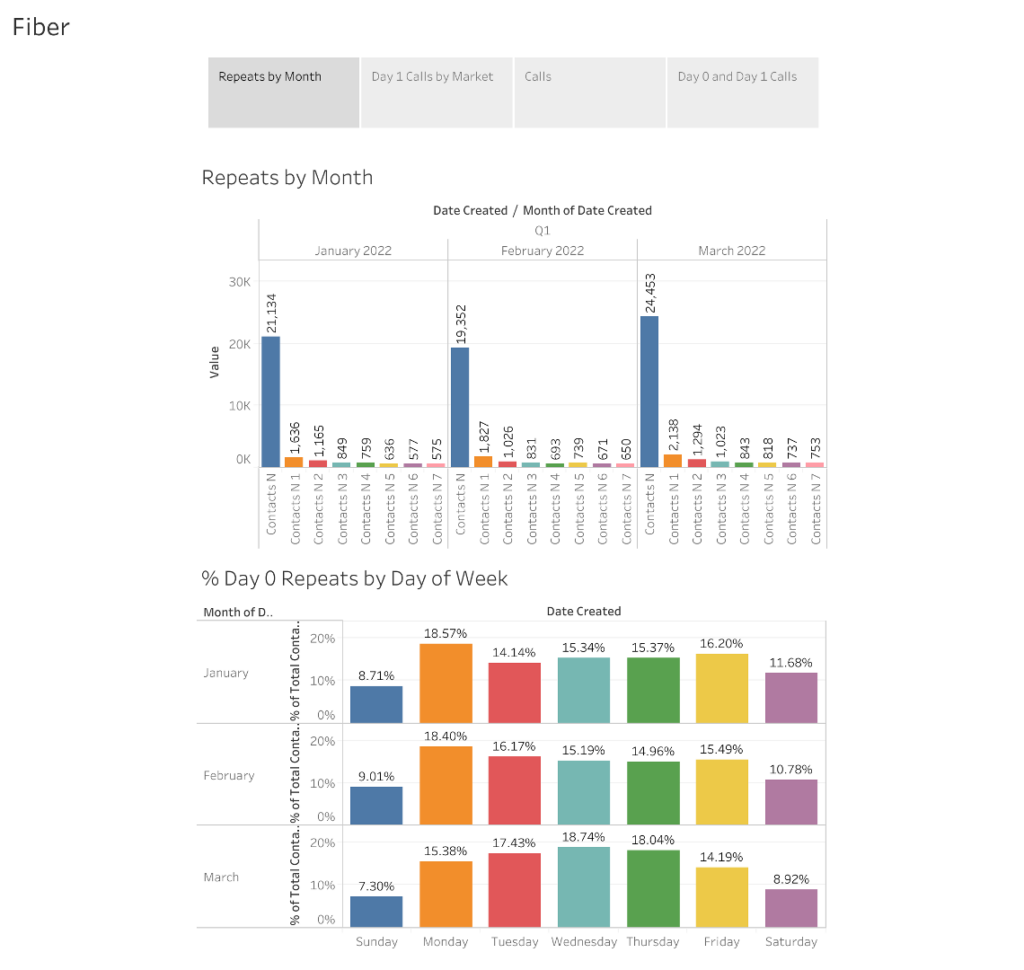
The first tab of the dashboard contains two bar charts that provide valuable insights about customer service interactions.
Repeat Calls by Month
The first chart showcases the monthly count of repeat calls received by the customer service team.
The x-axis represented the timeline from the initial date (Contacts_N) when customers made their first call.
The chart allows you to analyze how frequently customers contacted the service team again within the same week.
For instance, in January, 1,636 customers reached out again just one day after their initial call, while only 575 customers made a repeat call after seven days.
First Contact Calls by Day of the Week
The second chart provides insights into the distribution of first contact calls based on the day of the week in January.
It visualizes the percentage of customers who initiated their first contact each day.
Notably, only 8.71% of customers made their first contact on Sundays, while most first-time interactions occurred on Mondays.
Tables
The second tab of the dashboard includes two tables: Repeat Calls by First Call Date and Calls by Market and Type.
Calls by Date
The first table allows stakeholders to explore the number of calls categorized by date.
It provides a comprehensive overview of the total call volume on different dates.
Stakeholders can analyze trends, patterns, and any notable spikes or dips in call activity over time.
Calls by Market and Problem Type
The second table further breaks down the calls into market and problem types, offering more specific information.
It helps stakeholders identify which markets experience the highest volume of calls and the specific problems that prompt repeat calls.
By examining this table, stakeholders can gain insights into the areas that require additional attention and improvement.
For example, they can determine if specific markets have recurring issues that must be addressed or if particular problem types are more likely to result in repeat calls.
Market and Type for First Repeat Calls
The Market and Type for First Repeat Calls uses the data from the previous tabs table to visualize further the problem types that generate the most repeat calls for different markets.
This section utilizes the data from the table in the previous tab to present visualizations that shed light on the problem types that lead to the highest number of repeat calls across various markets.
The visualizations help identify patterns and effectively prioritize efforts to address these recurring issues.
By focusing on these problem types, stakeholders can implement targeted strategies to reduce the number of repeat calls and improve customer satisfaction in specific markets.
Calls Across Q1
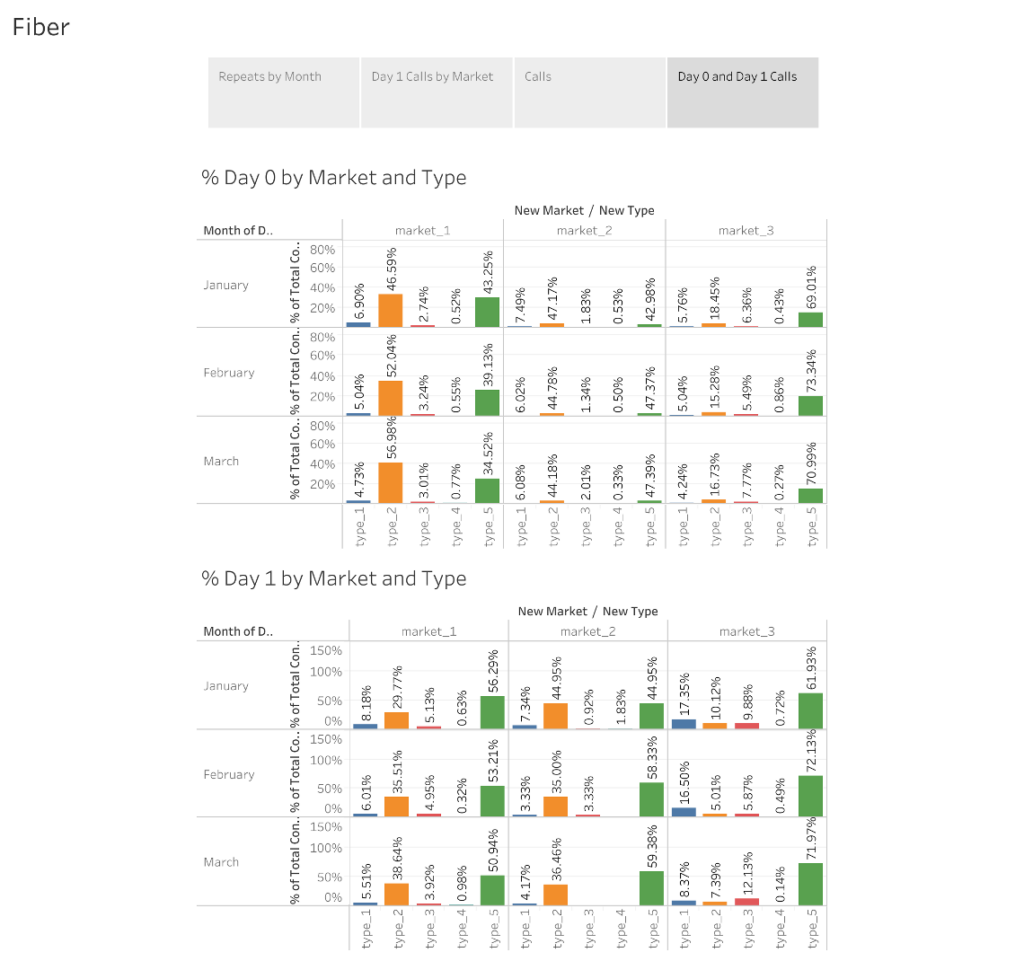
The final tab of the dashboard presents two charts that visualize the number of Day 0 calls and first repeat calls categorized by markets and problem types. These charts provide valuable insights into the call patterns during the year’s first quarter and highlight the markets and problems that generate initial calls and subsequent repeat calls.
Day 0 Calls by Markets and Problem Types
The first chart visualizes the number of Day 0 calls, the initial customer contacts segmented by different markets and problem types.
It allows users to understand which markets experience the highest volume of calls and the specific problem areas that prompt these initial calls.
First Repeat Calls by Markets and Problem Types
The second chart visualizes the number of first repeat calls, indicating when customers reach out again after their initial contact, categorized by markets and problem types.
It provides insights into the markets and specific problem areas that lead to repeat customer calls.
Through these charts, we can gain valuable insights into the call patterns, market dynamics, and problem areas that generate calls during the year’s first quarter.
Key insights
Repeat Calls Analysis:
The number of repeat calls varies depending on the duration after the initial call, with a significant drop observed after one week.
Understanding the reasons behind repeat calls can help identify areas for improvement in customer service or product offerings.
Day of the Week Analysis
Monday is the most common day for customers to make their first contact, indicating a higher demand for customer service at the beginning of the week.
The lower percentage of first contacts on Sundays suggests a potential need for optimizing customer service available on weekends.
Calls by Date
Analyzing the number of calls by date helps identify trends, patterns, and any significant spikes or dips in call activity over time.
It allows tracking and monitoring of the overall call volume and identifying potential correlations with marketing campaigns, product launches, or other external factors.
Calls by Market and Problem Type
Understanding which markets experience the most calls helps prioritize resources and focus on improving customer service for those specific markets.
Identifying problem types that generate repeat calls allows for targeted efforts to address and resolve those recurring issues, leading to improved customer satisfaction.
First Quarter Insights
Analyzing the number of Day 0 calls and first repeat calls by markets and problem types during the first quarter provides a snapshot of the most active markets and prevalent problem areas.
Dashboard Link: Fiber Case Study