
Goals
- What are some trends in smart device usage?
- How could these trends apply to Bellabeat customers?
- How could these trends help influence Bellabeat marketing strategy?
For the purpose of this research I was encouraged to use following public data: FitBit Fitness Tracker Data (CC0: Public Domain, dataset made available through Mobius): This Kaggle data set contains personal fitness tracker from thirty fitbit users. Thirty eligible Fitbit users consented to the submission of personal tracker data, including minute-level output for physical activity, heart rate, and sleep monitoring. It includes information about daily activity, steps, and heart rate that can be used to explore users’ habits. After brief exploration of the dataset, I can suggest that Data is Reliable, Original, Comprehensive, Current and Cited.
Installing and loading common packages and libraries
install.packages('tidyverse', repos = "http://cran.us.r-project.org")##
## The downloaded binary packages are in
## /var/folders/1r/8h_kl20n6qz_d2dwdpblvmm00000gt/T//RtmpfZo4Qe/downloaded_packagesinstall.packages('ggplot2', repos = "http://cran.us.r-project.org")##
## The downloaded binary packages are in
## /var/folders/1r/8h_kl20n6qz_d2dwdpblvmm00000gt/T//RtmpfZo4Qe/downloaded_packagesinstall.packages('ggthemes', repos ="http://cran.us.r-project.org")##
## The downloaded binary packages are in
## /var/folders/1r/8h_kl20n6qz_d2dwdpblvmm00000gt/T//RtmpfZo4Qe/downloaded_packageslibrary(tidyverse) #helps wrangle data## ── Attaching packages ─────────────────────────────────────── tidyverse 1.3.1 ──## ✓ ggplot2 3.3.5 ✓ purrr 0.3.4
## ✓ tibble 3.1.3 ✓ dplyr 1.0.7
## ✓ tidyr 1.1.3 ✓ stringr 1.4.0
## ✓ readr 2.0.0 ✓ forcats 0.5.1## ── Conflicts ────────────────────────────────────────── tidyverse_conflicts() ──
## x dplyr::filter() masks stats::filter()
## x dplyr::lag() masks stats::lag()library(ggplot2) #helps visualize data
library(ggthemes)
getwd() #displays my working directory## [1] "/Users/jn/Case-study/CSV/Bellabeat-Case-Study"setwd("//Users/jn/Case-study/CSV/Bellabeat-Case-Study") Collect Data
daily_activity <- read.csv("dailyActivity_merged.csv")
sleep_day <- read.csv("sleepDay_merged.csv")
Exploring a few key tables
Take a look at the daily_activity data.
head(daily_activity)## Id ActivityDate TotalSteps TotalDistance TrackerDistance
## 1 1503960366 4/12/2016 13162 8.50 8.50
## 2 1503960366 4/13/2016 10735 6.97 6.97
## 3 1503960366 4/14/2016 10460 6.74 6.74
## 4 1503960366 4/15/2016 9762 6.28 6.28
## 5 1503960366 4/16/2016 12669 8.16 8.16
## 6 1503960366 4/17/2016 9705 6.48 6.48
## LoggedActivitiesDistance VeryActiveDistance ModeratelyActiveDistance
## 1 0 1.88 0.55
## 2 0 1.57 0.69
## 3 0 2.44 0.40
## 4 0 2.14 1.26
## 5 0 2.71 0.41
## 6 0 3.19 0.78
## LightActiveDistance SedentaryActiveDistance VeryActiveMinutes
## 1 6.06 0 25
## 2 4.71 0 21
## 3 3.91 0 30
## 4 2.83 0 29
## 5 5.04 0 36
## 6 2.51 0 38
## FairlyActiveMinutes LightlyActiveMinutes SedentaryMinutes Calories
## 1 13 328 728 1985
## 2 19 217 776 1797
## 3 11 181 1218 1776
## 4 34 209 726 1745
## 5 10 221 773 1863
## 6 20 164 539 1728Identify all the columsn in the daily_activity data.
colnames(daily_activity)## [1] "Id" "ActivityDate"
## [3] "TotalSteps" "TotalDistance"
## [5] "TrackerDistance" "LoggedActivitiesDistance"
## [7] "VeryActiveDistance" "ModeratelyActiveDistance"
## [9] "LightActiveDistance" "SedentaryActiveDistance"
## [11] "VeryActiveMinutes" "FairlyActiveMinutes"
## [13] "LightlyActiveMinutes" "SedentaryMinutes"
## [15] "Calories"Take a look at the sleep_day data.
head(sleep_day)## Id SleepDay TotalSleepRecords TotalMinutesAsleep
## 1 1503960366 4/12/2016 12:00:00 AM 1 327
## 2 1503960366 4/13/2016 12:00:00 AM 2 384
## 3 1503960366 4/15/2016 12:00:00 AM 1 412
## 4 1503960366 4/16/2016 12:00:00 AM 2 340
## 5 1503960366 4/17/2016 12:00:00 AM 1 700
## 6 1503960366 4/19/2016 12:00:00 AM 1 304
## TotalTimeInBed
## 1 346
## 2 407
## 3 442
## 4 367
## 5 712
## 6 320Identify all the columsn in the daily_activity data.
colnames(sleep_day)## [1] "Id" "SleepDay" "TotalSleepRecords"
## [4] "TotalMinutesAsleep" "TotalTimeInBed"Note that both datasets have the ‘Id’ field – this can be used to merge the datasets.
Understanding some summary statistics
How many unique participants are there in each dataframe?
n_distinct(daily_activity$Id)## [1] 33n_distinct(sleep_day$Id)## [1] 24There more participants in the daily activity dataset than the sleep dataset. The dataset contains information about 33 unique users and not 30 as advised initially. By all means sample size is not sufficient enough to provide accurate results. Within available data we see that Fitbit users do not use sleep-related and heart-related features as often as step and calories calculator. There is no information in relation to gender identity of the participants hence data analysis cannot be used to influence menstrual cycle-related products of the company. Data does not contain information about water consumption.
How many observations are there in each dataframe?
nrow(daily_activity)## [1] 940nrow(sleep_day)## [1] 413What are some quick summary statistics we’d want to know about each data frame?
For the daily activity dataframe:
daily_activity %>%
  select(TotalSteps,
         TotalDistance,
         SedentaryMinutes) %>%
  summary()
## TotalSteps TotalDistance SedentaryMinutes
## Min. : 0 Min. : 0.000 Min. : 0.0
## 1st Qu.: 3790 1st Qu.: 2.620 1st Qu.: 729.8
## Median : 7406 Median : 5.245 Median :1057.5
## Mean : 7638 Mean : 5.490 Mean : 991.2
## 3rd Qu.:10727 3rd Qu.: 7.713 3rd Qu.:1229.5
## Max. :36019 Max. :28.030 Max. :1440.0For the sleep dataframe:
sleep_day %>%
  select(TotalSleepRecords,
  TotalMinutesAsleep,
  TotalTimeInBed) %>%
  summary()
## TotalSleepRecords TotalMinutesAsleep TotalTimeInBed
## Min. :1.000 Min. : 58.0 Min. : 61.0
## 1st Qu.:1.000 1st Qu.:361.0 1st Qu.:403.0
## Median :1.000 Median :433.0 Median :463.0
## Mean :1.119 Mean :419.5 Mean :458.6
## 3rd Qu.:1.000 3rd Qu.:490.0 3rd Qu.:526.0
## Max. :3.000 Max. :796.0 Max. :961.0What does this tell us about how this sample of people’s activities?
Plotting a few explorations
What’s the relationship between steps taken in a day and sedentary minutes?
ggplot(data=daily_activity, aes(x=TotalSteps, y=SedentaryMinutes)) + geom_point() +
labs(title = "Total Steps vs Sedentary Minutes")+
  xlab("Total Steps")+ylab("Sedentary Minutes")+
  geom_smooth(method = "lm", se = FALSE, color = "red") +
  theme(plot.background = element_rect(fill = "lightblue"))
## `geom_smooth()` using formula 'y ~ x' ### Scatter plot of changes in steps/day and changes in minutes of Sedentary.
What’s the relationship between minutes asleep and time in bed? You might expect it to be almost completely linear – are there any unexpected trends?
ggplot(data=sleep_day, aes(x=TotalMinutesAsleep, y=TotalTimeInBed)) + geom_point()+
labs(title = "Total Minutes Asleep vs Total Time in Bed",subtitle = "How much longer people stay in bed?")+
  xlab("Total Minutes Asleep")+ylab("Total time in bed")+
  geom_smooth(method = "lm", se = FALSE, color = "red") +
  theme(plot.background = element_rect(fill = "lightblue"))
## `geom_smooth()` using formula 'y ~ x'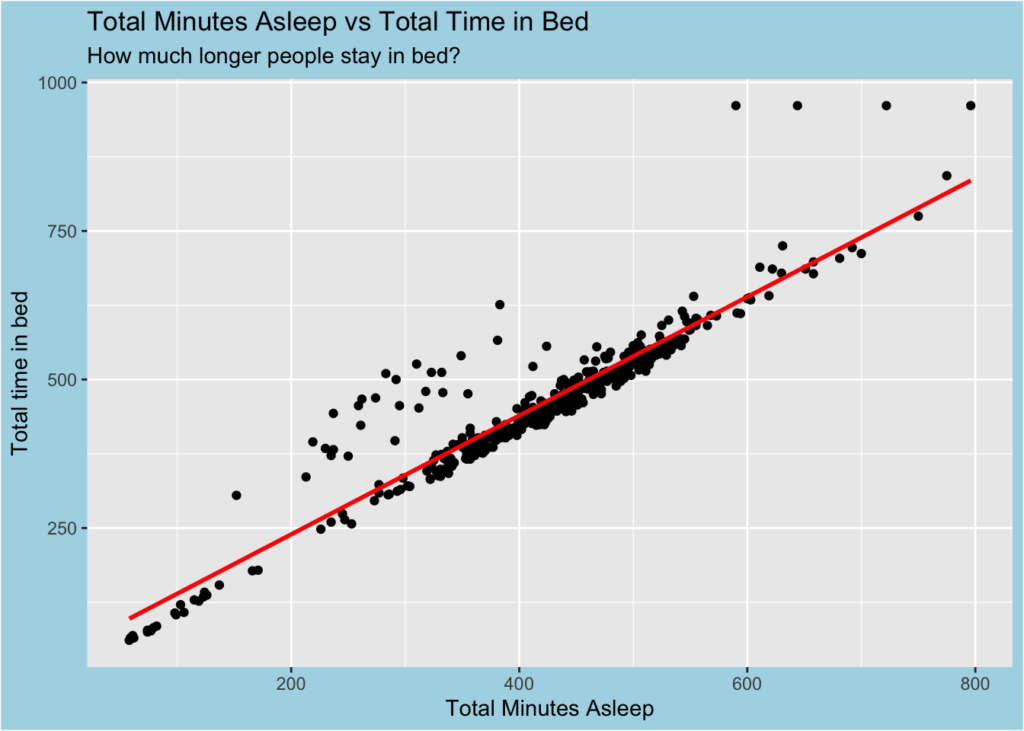
Merging these two datasets together
combined_data <- merge(sleep_day, daily_activity, by="Id")Take a look at how many participants are in this data set.
n_distinct(combined_data$Id)## [1] 24Recommendations
- To ensure more detailed and accurate data, Bellabeat should aim to collect data from a sample of at least 377 participants or utilize external data sources. This sample size will provide a 95% confidence level with a 5% margin of error for populations larger than 20,000.
- To enhance data accuracy, it is crucial to focus on meticulous data collection and recording processes, especially regarding step counts. By ensuring accurate data, Bellabeat can leverage this advantage in their marketing strategies for the Bellabeat Leaf and app, potentially driving higher sales among women.
- Analyzing Fitbit’s data, we observe that people tend to use smartwatches for step and calorie tracking more frequently than sleep tracking. To address this, I recommend developing an upgrade for the Bellabeat app, Leaf, and Time that enables automatic monitoring of movement during sleep. This automated process would yield additional user data without requiring manual input.
- The graph clearly indicates that a significant portion of participants remain in bed even when they are awake, potentially using their phones. In response, Bellabeat can consider implementing a notification feature in the Leaf and app to remind users to drink more water. Leveraging the awareness that users are awake, the smart bottle could generate reminders autonomously.
- Furthermore, the graph highlights the inverse relationship between walking and sedentary time. Encouraging increased walking not only reduces sedentary behavior but also promotes exercise and water consumption. Therefore, developing additional features such as water drink notifications and reminders would have a positive impact on both Bellabeat’s sales and the overall health of the population.
- By embracing these data insights and implementing appropriate strategies, Bellabeat can enhance their products’ accuracy, user engagement, and sales, ultimately improving the well-being of their customers.